lpedrazzi,
Cita:
|
Empezado por lpedrazzi
...estoy realizando un simple gráfico de barras con los resultados de una query, el problema que se me presenta es que no se como puedo poner valores tipo string en el eje "y" por ejemplo los nombres de los meses...
|
Los valores tipo String
solo se pueden colocar en el eje X, el eje Y requiere de valores numéricos para poder graficar ")
Revisa este código:
Código Delphi
[-]
unit Unit1;
interface
uses
Windows, Messages, SysUtils, Variants, Classes, Graphics, Controls, Forms,
Dialogs, StdCtrls, Buttons, ExtCtrls, TeeProcs, TeEngine, Chart, DB, DBClient,
Series;
type
TForm1 = class(TForm)
Chart1: TChart;
BitBtn1: TBitBtn;
BitBtn2: TBitBtn;
Series1: TBarSeries;
procedure BitBtn2Click(Sender: TObject);
procedure BitBtn1Click(Sender: TObject);
procedure FormCreate(Sender: TObject);
procedure FormClose(Sender: TObject; var Action: TCloseAction);
private
public
end;
const
GColor : Array[1..12] of TColor = (clGreen, clOlive, clNavy, clPurple, clTeal,
clGray, clSilver, clRed, clLime, clYellow,
clBlue, clFuchsia);
var
Form1: TForm1;
Table : TClientDataset;
implementation
{$R *.dfm}
procedure TForm1.FormCreate(Sender: TObject);
begin
Randomize;
end;
procedure TForm1.BitBtn1Click(Sender: TObject);
var
i : Integer;
begin
if Assigned(Table) then FreeAndNil(Table);
Table := TClientDataset.Create(Application);
Table.FieldDefs.Add('CodProd', ftString, 10, False);
Table.FieldDefs.Add('Cantidad', ftInteger,0, False);
Table.FieldDefs.Add('Date', ftDate, 0, False);
Table.FieldDefs.Add('Status', ftBoolean, 0, False);
Table.CreateDataset;
Table.Open;
for i := 1 to 12 do
begin
Table.Append;
Table.FieldByName('CodProd').AsString := Format('PRD%.3d',[i]);
Table.FieldByName('Cantidad').AsInteger := Random(1000);
Table.FieldByName('Date').AsDateTime := Now;
Table.FieldByName('Status').AsBoolean := True;
Table.Post;
end;
Table.Close;
end;
procedure TForm1.BitBtn2Click(Sender: TObject);
var
CodProd : String;
Cantidad : Integer;
i : Integer;
begin
if Assigned(Table) then
begin
i := 1;
with Chart1 do
begin
Title.Text.Clear;
Title.Text.Add('Gráfico de Productos vs Cantidad');
Legend.Visible := False;
LeftAxis.Title.Caption := 'Cantidad';
LeftAxis.Title.Font.Color := clBlue;
BottomAxis.Title.Caption := 'Productos';
BottomAxis.Title.Font.Color := clBlue;
end;
with Series1 do
begin
Clear;
Marks.Style := smsPercent;
with Table do
begin
Open;
while not eof do
begin
CodProd := Table.FieldByName('CodProd').AsString;
Cantidad := Table.FieldByName('Cantidad').AsInteger;
Add(Cantidad, CodProd, GColor[i]);
inc(i);
Next;
end;
Close;
end;
end;
end;
end;
procedure TForm1.FormClose(Sender: TObject; var Action: TCloseAction);
begin
FreeAndNil(Table);
Action := caFree;
end;
end.
El código anterior en Delphi 7 sobre Windows 7 Professional x32,
crea una tabla en memoria y su gráfico de barras asociado, como se puede ver en la siguiente imagen:
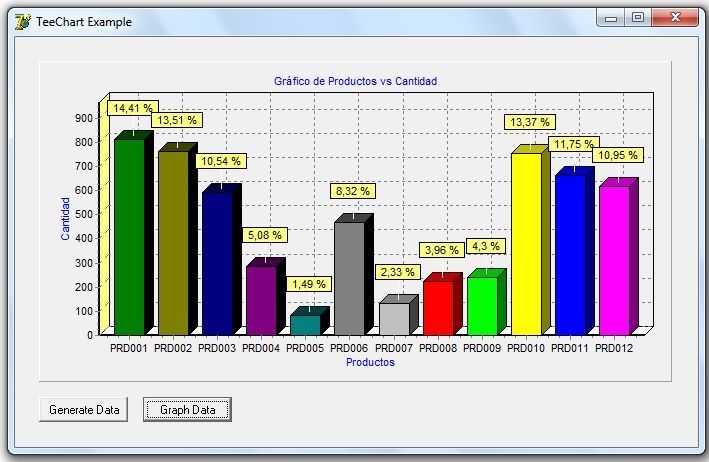
Espero sea útil

Nelson.